Grafana is a data analytics and visualization tool that helps you better understand your data by displaying it in various beautiful graphs and diagrams inside a dashboard. It furthermore enables you to set up alerts if your metrics reach a particular threshold.
In this article, you will build a Grafana dashboard to visualize the data of a temperature sensor that will be read using a microcontroller and send over MQTT.
Prerequisites
Before you begin this guide, you’ll need the following:
- Docker - Used for installing and using MQTT, Telegraf, InfluxDB and Grafana
- ESP8266 Microcomputer for reading a temperature sensor and sending the data over to your server (You can use a Golang script to send fake data if you don’t have the required hardware. This script will also be included in the article.)
Technology Stack
Now that you have an overview of what you are going to build and which tools will be used, it is essential to know how the components work together and exchange data.
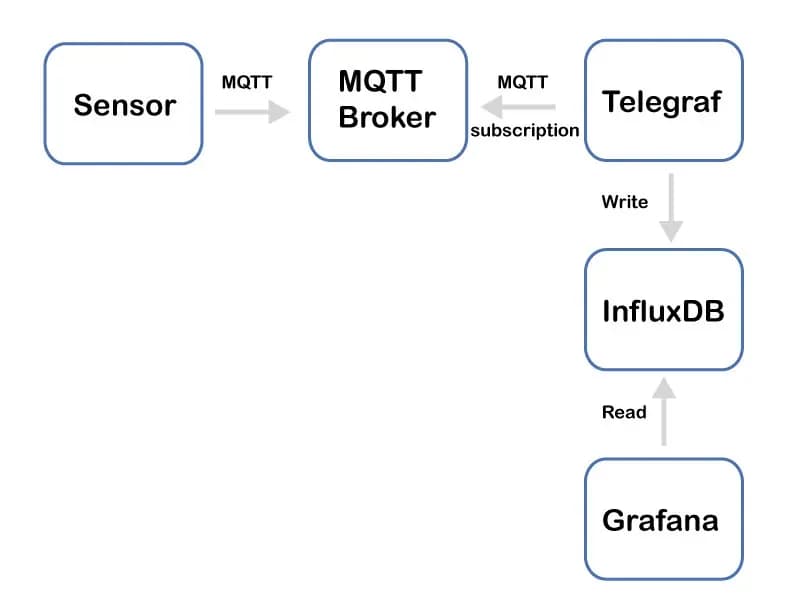
Let’s break the different components down:
- The ESP8266 reads the data from the temperature sensor and sends it to an MQTT broker.
- Telegraf subscribes to the MQTT topic and saves the received that into the InfluxDB database.
- Grafana reads the data from the InfluxDB database and visualizes it on a custom dashboard.
Step 1 - Running a Mosquitto MQTT server
In this section, you will install Mosquitto on your server and exposing its ports to the host machine using Docker and validate your installation by listing your containers.
First, you will install Mosquitto by running the official eclipse-mosquitto image and exposing the two working ports.
docker run -it -p 1883:1883 -p 9001:9001 -d eclipse-mosquittoThe -p flag is used to define the ports that you want to expose on the host. The -d flag on the other hand defines that you want to run the container in detached mode.
The installation can be validated by listing all containers and looking at the status field.
docker ps

# Output
CONTAINER ID        IMAGE               COMMAND                  CREATED             STATUS              PORTS                                            NAMES
a46c878e2943        eclipse-mosquitto   "/docker-entrypoint.…"   6 seconds ago       Up 5 seconds        0.0.0.0:1883->1883/tcp, 0.0.0.0:9001->9001/tcp   fervent_borg
Step 2 - Installing and running InfluxDB
Now that you have the Mosquitto MQTT Broker up and running, you will continue by installing InfluxDB and creating a new database.
InfluxDB also provides an official Docker image that makes it easy to deploy their service.
docker run -d -p 8086:8086 -v influxdb:/var/lib/influxdb --name influxdb influxdbThe -v flag defines a volume that will save the database’s data even if the container is restarted or destroyed.
After the installation is done, it is time to create the database that will be used to save the data. For that, you will need to use the InfluxDB CLI which you can open using the following command.
docker exec -it influxdb influxYou should now be in the InfluxDB CLI and can continue by creating the database and the telegraf user.
CREATE DATABASE sensors
CREATE USER telegraf WITH PASSWORD 'telegraf'
GRANT ALL ON sensors TO telegraf
Here you first create a database named sensors and then create a user called telegraf and grant him full access to the database.
Step 3 - Configuring and running Telegraf
Let’s continue by installing and configuring Telegraf, a metric collection, and processing agent that collects the data sent to the MQTT broker and stores it in your InfluxDB database.
The first step of the configuration process is to generate the default configuration by starting a Telegraf docker container and copying the config to the host filesystem.
docker run --rm telegraf telegraf config > telegraf.confYou should now have a telegraf.conf file in your directory. Here you will have to modify some fields under the inputs.mqtt_consumer tag, which defines the information of your MQTT broker.
[[inputs.mqtt_consumer]]
  ## MQTT broker URLs to be used. The format should be scheme://host:port,
  ## schema can be tcp, ssl, or ws.
  servers = ["tcp://10.0.0.22:1883"]

  ## Topics that will be subscribed to.
  topics = [
    "sensors"
  ]

  data_format = "influx"
The output will be configured under the outputs.influxdb tag which defines the following parameters:
- The URL of the InfluxDB database
- The database name
- Authentication parameters (username, password)
[[outputs.influxdb]]
  ## Multiple URLs can be specified for a single cluster, only ONE of the
  ## urls will be written to each interval.
  urls = ["http://10.0.0.8:8086"]

  ## The target database for metrics; will be created as needed.
  ## For UDP url endpoint database needs to be configured on server side.
  database = "sensors"

  ## If true, no CREATE DATABASE queries will be sent.  Set to true when using
  ## Telegraf with a user without permissions to create databases or when the
  ## database already exists.
  skip_database_creation = true

  ## HTTP Basic Auth
  username = "telegraf"
  password = "telegraf"
After the configuration is finished Telegraf can be started using Docker. The configuration will be transferred into the container using a volume.
docker run -d -v $PWD/telegraf.conf:/etc/telegraf:ro telegrafStep 4 - Sending data using Golang
This section will show you how you can send data to Telegraf using MQTT in Golang. This can be done using the following steps:
- Connecting to the MQTT broker using the paho.mqtt library
- Checking if the connection was successfully established
- Continuously sending data to the
sensorstopic
This section is meant for the people who don’t have a microcontroller and temperature sensor and still want to follow the article for the Grafana part. If you want to send the real sensor data using your ESP8266 or another microcontroller, you can skip this section.
First, you will need to create a Golang file using the following command:
touch mqtt.goThis command will create a file named mqtt.go in your current directory. Now open the file in your favorite code editor to continue.
Next, you will install the needed dependency for working with MQTT in Golang.
github.com/eclipse/paho.mqtt.golangNow that the file is created and the dependencies are successfully downloaded, it is time to connect to the MQTT broker.
Connecting can be done using the mqtt.NewClient() function and passing your MQTT client options as an argument. These options consist of the MQTT broker URL, username, password and client id.
After that, you need to check if the connection has been established successfully by checking if the received error is nil.
package main

import (
	"fmt"
	"log"
	"math/rand"
	"net/url"
	"strconv"
	"time"

	mqtt "github.com/eclipse/paho.mqtt.golang"
)

func connect(clientId string, uri *url.URL) mqtt.Client {
	opts := createClientOptions(clientId, uri)
	client := mqtt.NewClient(opts)
	token := client.Connect()
	for !token.WaitTimeout(3 * time.Second) {
	}
	if err := token.Error(); err != nil {
		log.Fatal(err)
	}
	return client
}

func createClientOptions(clientId string, uri *url.URL) *mqtt.ClientOptions {
	opts := mqtt.NewClientOptions()
	opts.AddBroker(fmt.Sprintf("tcp://%s", uri.Host))
	opts.SetUsername("mqtt")
	password := ""
	opts.SetPassword(password)
	opts.SetClientID(clientId)
	return opts
}

func main() {
	uri, err := url.Parse("tcp://10.0.0.22:1883")
	if err != nil {
		log.Fatal(err)
	}

	client := connect("pub", uri)
}
Once that is done you can start sending data to the MQTT broker using the Publish() function. Here we send a random value between 10 and 100 every second to the sensors topic we defined earlier.
func main() {
	uri, err := url.Parse("tcp://10.0.0.22:1883")
	if err != nil {
		log.Fatal(err)
	}

	client := connect("pub", uri)
	timer := time.NewTicker(1 * time.Second)
	for t := range timer.C {
		fmt.Println(t)
		var min int64 = 10
		var max int64 = 100
		var random int64 = (rand.Int63n(max-min) + min)
		nsec := time.Now().UnixNano()
		payload := "weather,location=us-midwest temperature=" + strconv.FormatInt(random, 10) + " " + strconv.FormatInt(nsec, 10)
		client.Publish("sensors", 0, false, payload)
	}
}
These configuration blocks will result in the following file:
package main

import (
	"fmt"
	"log"
	"math/rand"
	"net/url"
	"strconv"
	"time"

	mqtt "github.com/eclipse/paho.mqtt.golang"
)

func connect(clientId string, uri *url.URL) mqtt.Client {
	opts := createClientOptions(clientId, uri)
	client := mqtt.NewClient(opts)
	token := client.Connect()
	for !token.WaitTimeout(3 * time.Second) {
	}
	if err := token.Error(); err != nil {
		log.Fatal(err)
	}
	return client
}

func createClientOptions(clientId string, uri *url.URL) *mqtt.ClientOptions {
	opts := mqtt.NewClientOptions()
	opts.AddBroker(fmt.Sprintf("tcp://%s", uri.Host))
	opts.SetUsername("mqtt")
	password := ""
	opts.SetPassword(password)
	opts.SetClientID(clientId)
	return opts
}

func main() {
	uri, err := url.Parse("tcp://10.0.0.22:1883")
	if err != nil {
		log.Fatal(err)
	}

	client := connect("pub", uri)
	timer := time.NewTicker(1 * time.Second)
	for t := range timer.C {
		fmt.Println(t)
		var min int64 = 10
		var max int64 = 100
		var random int64 = (rand.Int63n(max-min) + min)
		nsec := time.Now().UnixNano()
		payload := "weather,location=us-midwest temperature=" + strconv.FormatInt(random, 10) + " " + strconv.FormatInt(nsec, 10)
		client.Publish("sensors", 0, false, payload)
	}
}
Once you’re done, save and exit your file. After that you can run the script using the following command:
go run mqtt.goSending data using an ESP8266 MQTT client
Now that you have successfully set up your Mosquitto MQTT broker, InfluxDB and Telegraf it is time to send your sensor data. This section will show you how to do precisely that using an ESP8266 microcontroller and a TMP006 temperature sensor.
Note: The code may be different for other microcontrollers and temperature sensors.
The following steps need to be executed to successfully send data over MQTT:
- Connect your microcontroller to your Wi-Fi
- Connect to the MQTT broker
- Read your sensor data
- Send the data over MQTT
First you will have to install the following libraries. If you are using the Arduino IDE you can reference the official Arduino guide. If you are using the PlatformIO VS Code extension instead you can download them using the library manager.
#include <Arduino.h>
#include <Wire.h>
#include <SPI.h>
#include <ESP8266WiFi.h>
#include <PubSubClient.h>
#include <Adafruit_Sensor.h>
#include "Adafruit_TMP006.h"
Next, add your Wi-Fi credentials at the top and use them to connect to the internet using the Wi-Fi library.
// Update these with values suitable for your network.
const char* ssid = "ssid";
const char* password = "password";
const char* mqtt_server = "server_ip";

// Connecting to the WIFI network
void setup_wifi() {
  delay(10);

  Serial.println();
  Serial.print("Connecting to ");
  Serial.println(ssid);

  WiFi.mode(WIFI_STA);
  WiFi.begin(ssid, password);

  while (WiFi.status() != WL_CONNECTED) {
    delay(500);
    Serial.print(".");
  }

  randomSeed(micros());

  Serial.println("");
  Serial.println("WiFi connected");
  Serial.println("IP address: ");
  Serial.println(WiFi.localIP());
}


void setup() {
  Serial.begin(9600);

  setup_wifi();
}

void loop() {

}
After you have filled in your credentials, it is time to continue by connecting to the MQTT broker. You will also implement a function to reconnect to the broker if the connection fails.
WiFiClient espClient;
PubSubClient client(espClient);

void reconnect() {
  // Loop until we're reconnected
  while (!client.connected()) {
    Serial.print("Attempting MQTT connection...");
    // Create a random client ID
    String clientId = "ESP8266Client-";
    clientId += String(random(0xffff), HEX);
    // Attempt to connect
    if (client.connect(clientId.c_str(), "mqtt", "")) {
      Serial.println("connected");
      // Once connected, publish an announcement...
      client.publish("outTopic", "hello world");
      // ... and resubscribe
      client.subscribe("inTopic");
    } else {
      Serial.print("failed, rc=");
      Serial.print(client.state());
      Serial.println(" try again in 5 seconds");
      // Wait 5 seconds before retrying
      delay(5000);
    }
  }
}

void setup() {
  Serial.begin(9600);

  setup_wifi();

  client.setServer(mqtt_server, 1883);
}

void loop() {
  // Connect to the mqtt client
  if (!client.connected()) {
    reconnect();
  }
  client.loop();
}
Next, you will read the sensor data using the Adafruite_TMP006 library and send it over MQTT on the sensors topic.
// Create variable to hold mqtt messages
#define MSG_BUFFER_SIZE	(100)
char msg[MSG_BUFFER_SIZE];

void setup() {
  Serial.begin(9600);

  setup_wifi();

  client.setServer(mqtt_server, 1883);

  if (! tmp006.begin()) {
    Serial.println("No sensor found");
    while (1);
  }
}

void loop() {
  // Connect to the mqtt client
  if (!client.connected()) {
    reconnect();
  }
  client.loop();

  // Get the current object temperatur of the sensor
  float objt = tmp006.readObjTempC();

  // Create the message that will be send using mqtt
  String message = String("weather,location=us temperature="+String(objt));
  message.toCharArray(msg, message.length());
  Serial.println(msg);

  // Send the message on the sensors topic
  client.publish("sensors", msg);

  delay(1000);
}
The sensor needs to be initialized using the begin() function and can then be read using the readObjTempC() function.
After that, you can format the temperature data into a String that is accepted by the InfluxDB database. Then you can send it over MQTT using the publish() function on the MQTT client you created above.
These configuration blocks will result in the final following file:
#include <Arduino.h>
#include <Wire.h>
#include <SPI.h>
#include <ESP8266WiFi.h>
#include <PubSubClient.h>
#include <Adafruit_Sensor.h>
#include "Adafruit_TMP006.h"

Adafruit_TMP006 tmp006;

// Update these with values suitable for your network.
const char* ssid = "ssid";
const char* password = "password";
const char* mqtt_server = "server_ip";

WiFiClient espClient;
PubSubClient client(espClient);

// Create variable to hold mqtt messages
#define MSG_BUFFER_SIZE	(100)
char msg[MSG_BUFFER_SIZE];

// Connecting to the WIFI network
void setup_wifi() {
  delay(10);

  Serial.println();
  Serial.print("Connecting to ");
  Serial.println(ssid);

  WiFi.mode(WIFI_STA);
  WiFi.begin(ssid, password);

  while (WiFi.status() != WL_CONNECTED) {
    delay(500);
    Serial.print(".");
  }

  randomSeed(micros());

  Serial.println("");
  Serial.println("WiFi connected");
  Serial.println("IP address: ");
  Serial.println(WiFi.localIP());
}

void reconnect() {
  // Loop until we're reconnected
  while (!client.connected()) {
    Serial.print("Attempting MQTT connection...");
    // Create a random client ID
    String clientId = "ESP8266Client-";
    clientId += String(random(0xffff), HEX);
    // Attempt to connect
    if (client.connect(clientId.c_str(), "mqtt", "")) {
      Serial.println("connected");
      // Once connected, publish an announcement...
      client.publish("outTopic", "hello world");
      // ... and resubscribe
      client.subscribe("inTopic");
    } else {
      Serial.print("failed, rc=");
      Serial.print(client.state());
      Serial.println(" try again in 5 seconds");
      // Wait 5 seconds before retrying
      delay(5000);
    }
  }
}

void setup() {
  Serial.begin(9600);

  setup_wifi();

  client.setServer(mqtt_server, 1883);

  if (! tmp006.begin()) {
    Serial.println("No sensor found");
    while (1);
  }
}

void loop() {
  // Connect to the mqtt client
  if (!client.connected()) {
    reconnect();
  }
  client.loop();

  // Get the current object temperatur of the sensor
  float objt = tmp006.readObjTempC();

  // Create the message that will be send using mqtt
  String message = String("weather,location=us temperature="+String(objt));
  message.toCharArray(msg, message.length());
  Serial.println(msg);

  // Send the message on the sensors topic
  client.publish("sensors", msg);

  delay(1000);
}
You can now run the program by uploading it onto your microcontroller.
Step 5 - Running and configuring Grafana
Grafana is an analytics platform and one of the most popular data visualizers out there. Grafana makes it easy to build fully customizable dashboards using data from a wide variety of data sources.
In this section, you will start Grafana using Docker and configure InfluxDB as your data source. Then you will configure your Grafana dashboard by fetching your sensor data from the InfluxDB database.
First, you will start the Grafana docker container and publish port 3000 to your host system.
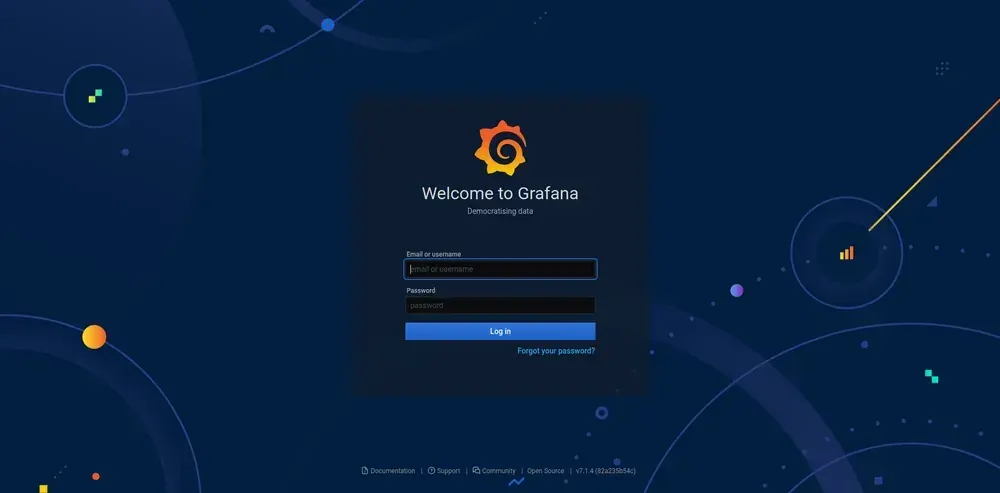
docker run -d -p 3000:3000 grafana/grafanaNow you should be able to visit Grafana on your localhost:3000 and see the following screen. Continue by login in with the standard credentials admin admin and feel free to change your password.
Next, navigate to the add data source page by clicking on Configuration > Data Sources in the side menu.
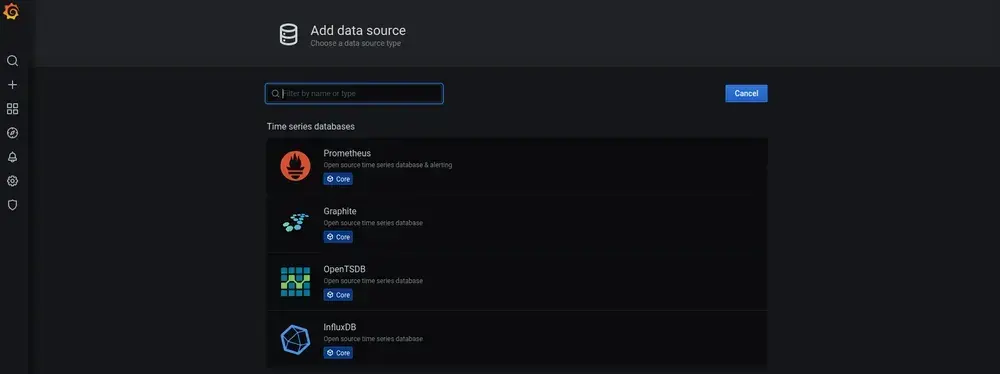
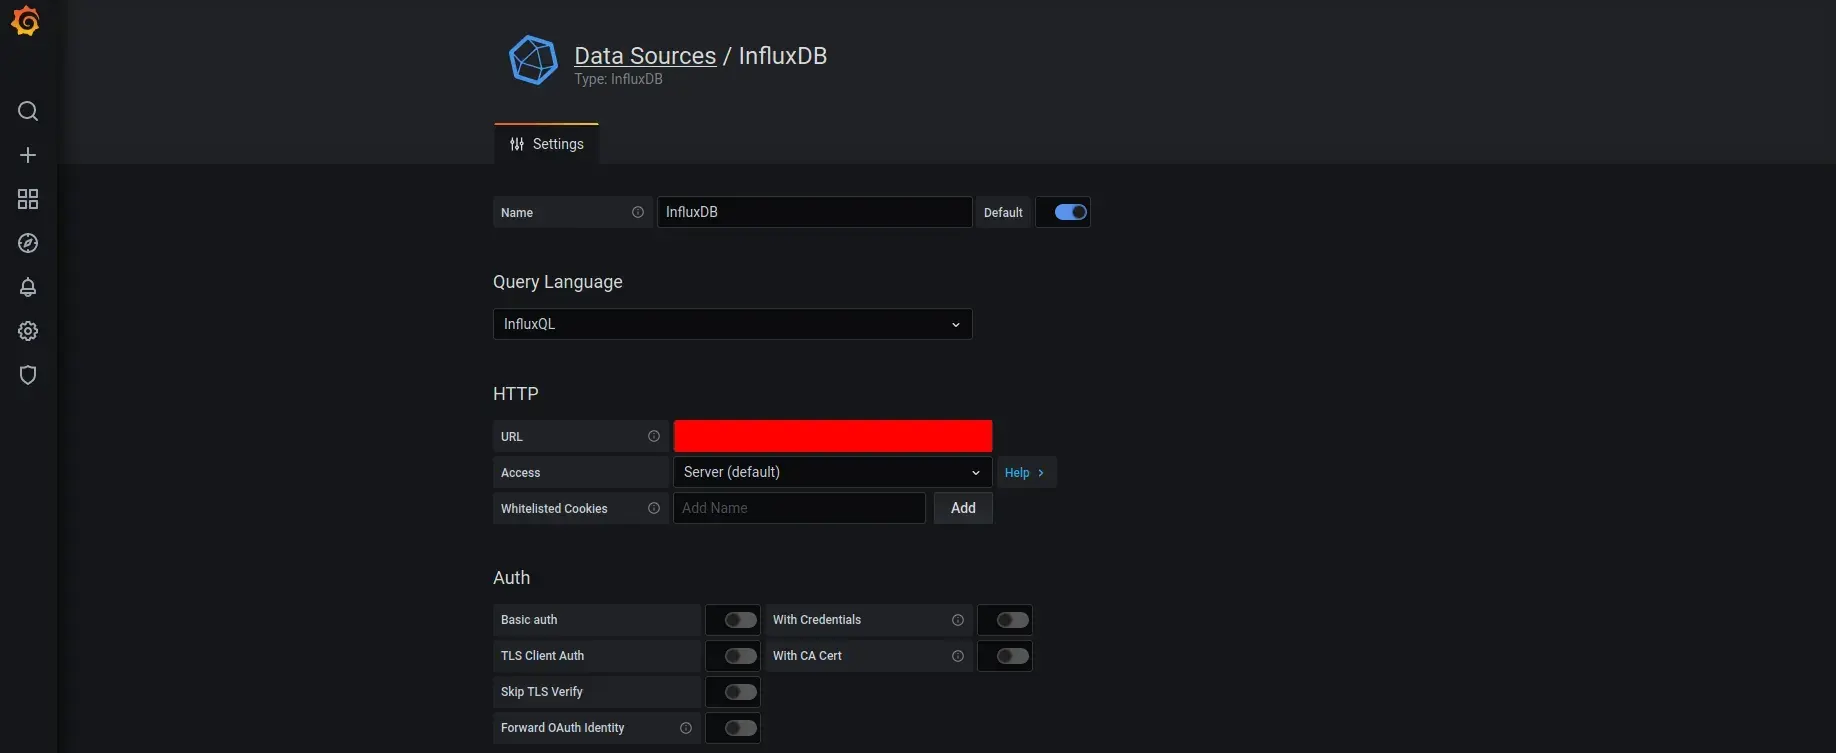
Continue by selecting InfluxDB from the time series databases drop-down menu. You now need to configure the data source by filling in the URL and database fields based on the settings you configured earlier.
The URL is a combination of the IP address and port of your InfluxDB API and the database is the database name you set earlier (Sensors if you followed the article).
After successfully configuring and saving the data source you can continue by creating a new dashboard. Follow the following steps for that:
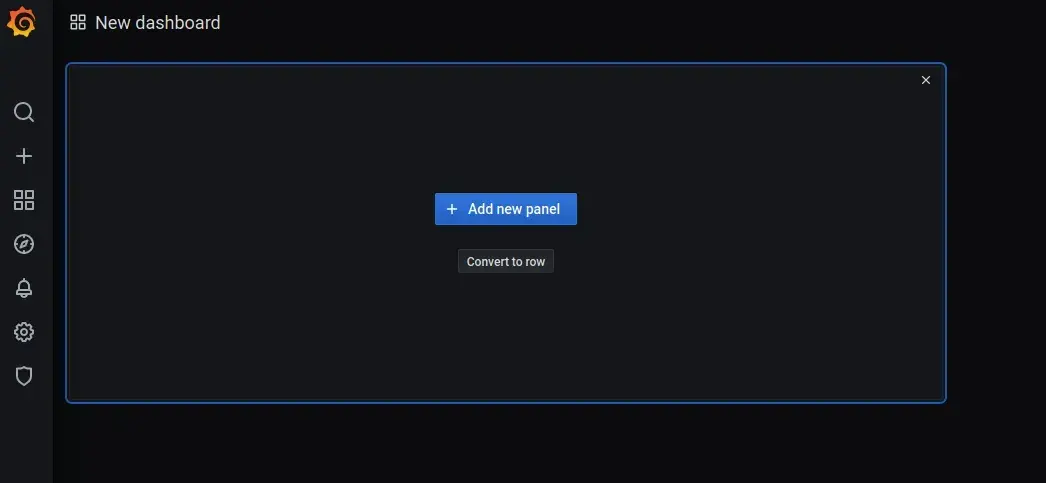
- Click New dashboard.
- Click Add new panel. Grafana creates a basic graph panel that needs to be configured using your InfluxDB data.
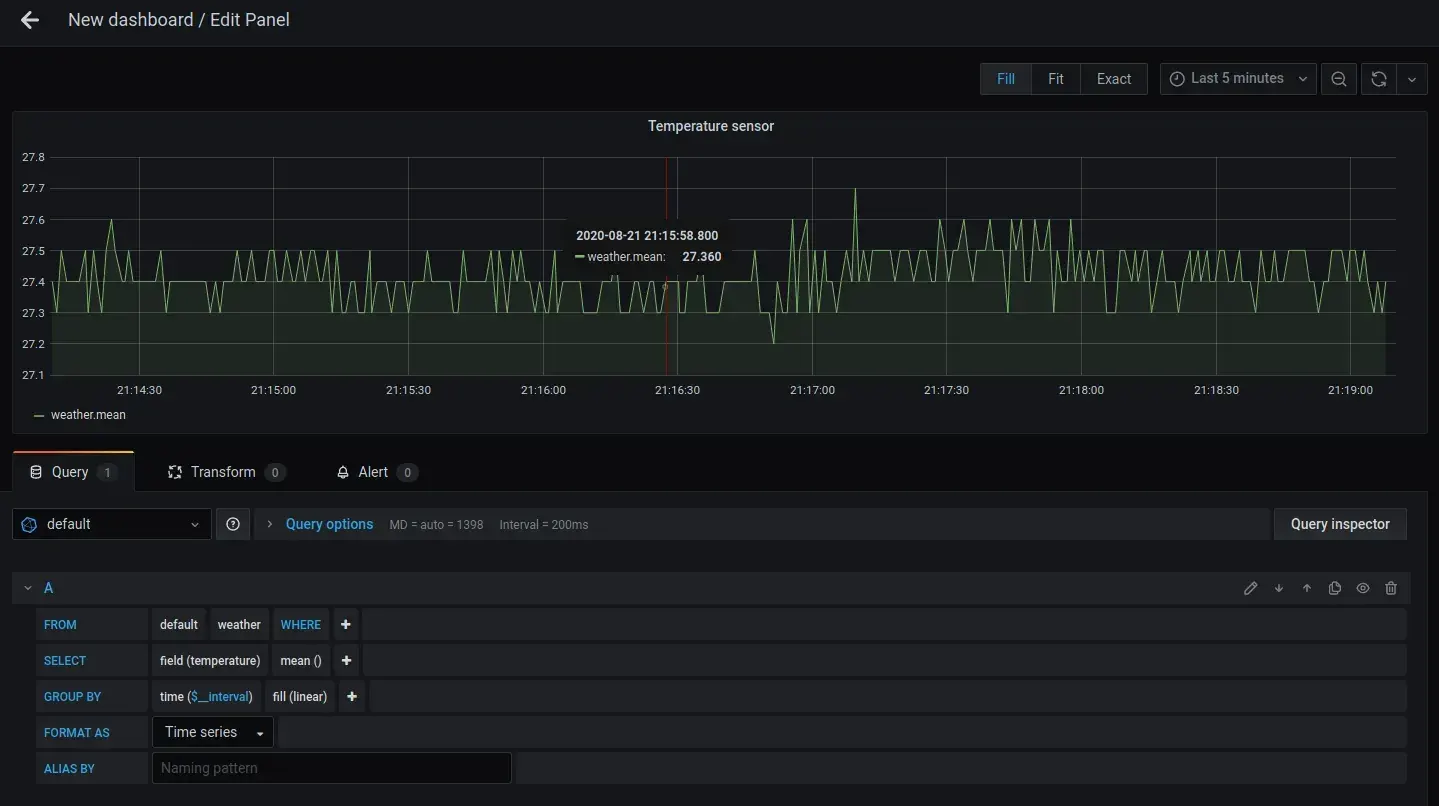
Now it is time to configure your panel using the data of your InfluxDB database. Here you need to select weather as the measurement you want to use for the from field. Then you need to select temperature as the field.
For more information about the query selector visit the official documentation.
After saving your dashboard by clicking the Save dashboard button in the top corner of your screen, the dashboard should look similar to this:
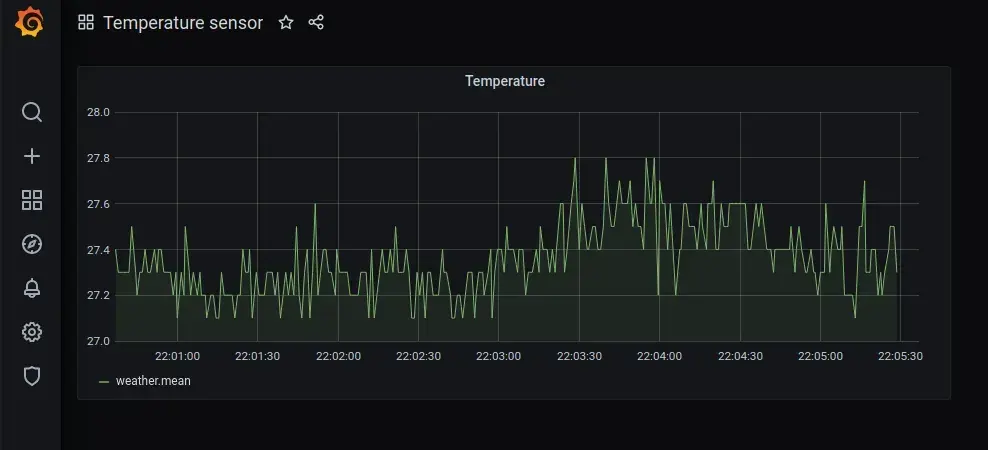
If you want more information about how to customize your Grafana dashboard and add different configurations, check out the official documentation.
Step 6 - Running the deployment using Docker Compose
Another way you can run this whole setup is through Docker compose, which makes the entire process a lot easier and more reusable.
In this section, you will learn how you can put all containers in a single Docker compose file and start it using a single command. If you don’t know what Docker compose is or how it works I recommend checking out this guide.
Let’s start with the basic structure of the file and the mosquitto container consists of an image and publishes two ports to the host.
version: '3.1'

services:
  mosquitto:
      image: eclipse-mosquitto
      hostname: mosquitto
      container_name: mosquitto
      ports:
        - "1883:1883"
        - "9001:9001"
The Telegraf container needs a bind mount to load your configuration into the container, which can be specified using the volumes key.
  telegraf:
    image: telegraf:latest
    container_name: telegraf
    links:
      - influxdb
    volumes:
      - ./telegraf.conf:/etc/telegraf/telegraf.conf:ro
The grafana container will have an normal volume instead which is defined using the volumes keyword at root level.
  grafana:
    image: grafana/grafana:latest
    container_name: grafana
    ports:
      - "3000:3000"
    links:
      - influxdb
    depends_on:
      - influxdb
    volumes:
      - grafana-storage:/var/lib/grafana

volumes:
  grafana-storage:
InfluxDB also sets the same kind of volume to save its data but will also define the database, username and password as environment variables, so you don’t need to configure it manually as you did above.
  influxdb:
    image: influxdb:latest
    container_name: influxdb
    ports:
      - "8083:8083"
      - "8086:8086"
      - "8090:8090"
    environment:
      - INFLUXDB_DB=sensors
      - INFLUXDB_USER=telegraf
      - INFLUXDB_USER_PASSWORD=telegraf
    volumes:
      - influxdb-storage:/var/lib/influxdb

volumes:
  influxdb-storage:
These configuration blocks will result in the following file:
version: '3.1'

services:
  influxdb:
    image: influxdb:latest
    container_name: influxdb
    ports:
      - "8083:8083"
      - "8086:8086"
      - "8090:8090"
    environment:
      - INFLUXDB_DB=sensors
      - INFLUXDB_USER=telegraf
      - INFLUXDB_USER_PASSWORD=telegraf
    volumes:
      - influxdb-storage:/var/lib/influxdb

  telegraf:
    image: telegraf:latest
    container_name: telegraf
    links:
      - influxdb
    volumes:
      - ./telegraf.conf:/etc/telegraf/telegraf.conf:ro

  grafana:
    image: grafana/grafana:latest
    container_name: grafana
    ports:
      - "3000:3000"
    links:
      - influxdb
    depends_on:
      - influxdb
    volumes:
      - grafana-storage:/var/lib/grafana

  mosquitto:
      image: eclipse-mosquitto
      hostname: mosquitto
      container_name: mosquitto
      ports:
        - "1883:1883"
        - "9001:9001"

volumes:
  influxdb-storage:
  grafana-storage:
Next, run the Docker compose file using the following command:
docker-compose up -dYou can now validate that the containers are running.
docker psYou have now successfully stored your sensor data in an InfluxDB database and visualized it on a Grafana dashboard. You also learned how to build a Docker compose file for easier usage and better re-usability.
Conclusion
In this article, you configured your own Grafana dashboard and sent data to it from your microcontroller using the MQTT communication protocol.
If you are interested in more articles like this one, I highly recommend joining my email list and following me on Twitter, so you never miss a new article.